Using LibreNMS v22.2.2, with Weathermap v0.98b. My map was created using the PHP web-based editor within LibreNMS (I believe this editor is part of the standard network-weathermap distribution?) to design the map.
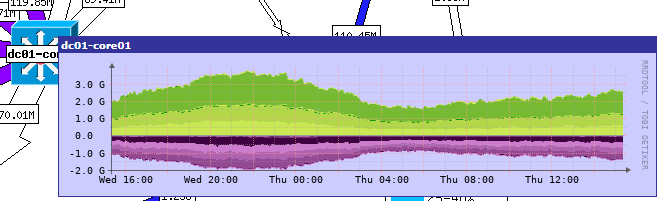
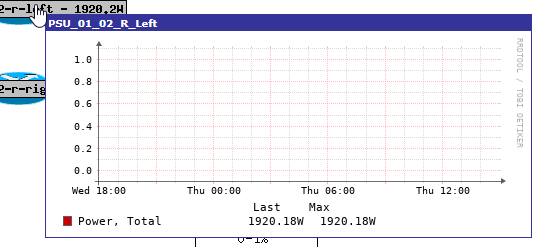
Everything works fine, except when I hover over a device and the “overlibgraph” image is popped up, the entire graph image is tinted blue. What would normally be a white background on the graph, has a light blue tint to it, almost as if it was a “selected” element on the page, except the mouse hasn’t been clicked or anything.
This happens in both Firefox and Chrome on Windows, so I don’t think it’s a browser issue, but can’t rule it out.
Snippet of the config stanza for a node, they are all similar, and this weird tint thing happens on all of them. Screenshot below the config.
Any ideas?
NODE dc01-core01
        LABEL dc01-core01
        INFOURL /device/device=23/
        OVERLIBGRAPH /graph.php?height=100&width=512&device=23&type=device_bits&legend=no
        ICON images/core_[UNKNOWN].gif
        POSITION 435 343